As a response to "Joe the Plumber" and his claims of Obama's 3% tax increase on income over $250,000 being called socialism or re-distribution of wealth - the evidence suggests that there has been a LONG history of income re-distribution however it is going from the middle-class to the wealthiest income earners. And this is structurally put into the laws.
To me there is nothing wrong with making a lot of money - however I'm not sure why all the rules are written to the benefit of the wealthiest (and they are!). Well - I know WHY - because the rich and powerful write the laws (or influence the politicians that do). I can't figure out why income your money makes in the stock market is taxed at a lower rate (capital gains) than income people make by laboring day in and day out. I can't figure out why the effective tax on many corporations is ZERO and why the effective tax rate of the wealthiest is less than the upper middle class. If you are at or around the AMT line - you are paying THE HIGHEST EFFECTIVE TAX RATE!
Quick side rant - I personally believe most financial companies are merely siphoning money out of the middle class and consolidating it into the hands of very few - which is why I manage all of my own finances and investing. Maybe said a better way - I'm not convinced that financial firms are actually adding value to the economy as a whole.
On the flip side - I also can't figure out why more than 50% of Americans don't have any federal tax liability when they use public services too - but you can see how the standard deduction was put in to offset everything else in this article below.
I hope we drastically change the tax code for individuals and businesses to make it a straight calculation based on income - and then you'll find the tax rate will be MUCH lower because there will be no loop holes or deductions for some and not for others.
http://motherjones.com/politics/2011/02/income-inequality-in-america-chart-graph

Eleven charts that explain everything that's wrong with America.
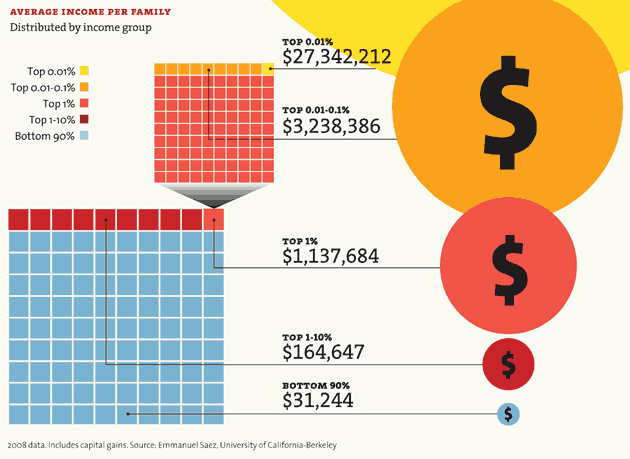
How Rich Are the Superrich?
A huge share of the nation's economic growth over the past 30 years has gone to the top one-hundredth of one percent, who now make an average of $27 million per household. The average income for the bottom 90 percent of us? $31,244.


Note: The 2007 data (the most current) doesn't reflect the impact of the housing market crash. In 2007, the bottom 60% of Americans had 65% of their net worth tied up in their homes. The top 1%, in contrast, had just 10%. The housing crisis has no doubt further swelled the share of total net worth held by the superrich.
Winners Take All
The superrich have grabbed the bulk of the past three decades' gains.

Out of Balance
A Harvard business prof and a behavioral economist recently asked more than 5,000 Americans how they thought wealth is distributed in the United States. Most thought that it’s more balanced than it actually is. Asked to choose their ideal distribution of wealth, 92% picked one that was even more equitable.

Capitol Gain
Why Washington is closer to Wall Street than Main Street.

| member | max. est. net worth |
|---|---|
| Rep. Darrell Issa (R-Calif.) | $451.1 million |
| Rep. Jane Harman (D-Calif.) | $435.4 million |
| Rep. Vern Buchanan (R-Fla.) | $366.2 million |
| Sen. John Kerry (D-Mass.) | $294.9 million |
| Rep. Jared Polis (D-Colo.) | $285.1 million |
| Sen. Mark Warner (D-Va.) | $283.1 million |
| Sen. Herb Kohl (D-Wisc.) | $231.2 million |
| Rep. Michael McCaul (R-Texas) | $201.5 million |
| Sen. Jay Rockefeller (D-W.Va.) | $136.2 million |
| Sen. Dianne Feinstein (D-Calif.) | $108.1 million |
| combined net worth: | $2.8 billion |


Congressional data from 2009. Family net worth data from 2007. Sources: Center for Responsive Politics; US Census; Edward Wolff, Bard College.
Who's Winning?
For a healthy few, it's getting better all the time.


YOUR LOSS,THEIR GAIN
How much income have you given up for the top 1 percent?

Sources
Income distribution: Emmanuel Saez (Excel)
Net worth: Edward Wolff (PDF)Household income/income share: Congressional Budget OfficeReal vs. desired distribution of wealth: Michael I. Norton and Dan Ariely (PDF)Net worth of Americans vs. Congress: Federal Reserve (average); Center for Responsive Politics (Congress)Your chances of being a millionaire: Calculation based on data from Wolffhousehold and population data) (PDF); US Census (Member of Congress' chances: Center for Responsive PoliticsWealthiest members of Congress: Center for Responsive PoliticsWall street profits, 2007-2009: New York State Comptroller (PDF)Unemployment rate, 2007-2009: Bureau of Labor StatisticsCEO vs. worker pay: Economic Policy InstituteHistoric tax rates: Calculations based on data from The Tax FoundationFederal tax revenue: Joint Committee on Taxation (PDF)
Read also: Kevin Drum on the decline of Big Labor, the rise of Big Business, and why the Obama era fizzled so soon.More Mother Jones charty goodness: How the rich get richer; how the poor get poorer; who owns Congress?
1 comment:
i thought you'd appreciate that article. jim and i talked about it that night too.
I think the wealth distribution intentions of america are nice but not at all realistic...
Post a Comment